Number Frequency in WinGo: Streaks, Repeats & History
Understand WinGo number frequency charts, repeated digits, historical counts, missing numbers, streaks and sample sizes, with worked examples of how to interpret results without claiming future predictions.
In this article
- What Is WinGo Number Frequency?
- How to Read a WinGo Number Frequency Chart
- Example: WinGo Frequency Over 20 Results
- How to Calculate WinGo Number Percentages
- WinGo Hot Numbers Explained
- What Are Cold or Missing Numbers?
- WinGo Repeated Numbers and Streaks
- Number Streaks vs Colour Streaks
- Why Sample Size Matters
- Theoretical Probability vs Observed Frequency
- Can WinGo Frequency Predict the Next Number?
- Why Hot and Cold Predictions Can Be Misleading
- WinGo Result Frequency vs Period Number
- How to Compare the Last 20 and Last 100 Results
- Frequency Charts and Different WinGo Durations
- Can Frequency Analysis Detect a Problem?
- Frequently Asked Questions
- What is WinGo number frequency?
- How do I calculate WinGo number percentages?
- What does a hot number mean?
- What is a cold number?
- Does a missing number have to appear next?
- Can a number repeat several times?
- Is a colour streak the same as a number streak?
- Is a twenty-round chart enough to predict the next result?
- Does a 10% theoretical probability mean exactly one result in every ten rounds?
- Can I mix different WinGo durations in one frequency chart?
- Final Thoughts
Number Frequency in WinGo refers to how often each numerical result appears within a selected set of completed rounds. A frequency chart may count the digits from 0 to 9, display repeated numbers or highlight values that have not appeared recently. These charts are useful for describing historical information, but they should not be confused with reliable predictions of future game outcomes.
Readers often encounter terms such as hot numbers, cold numbers, missing digits and result streaks when examining WinGo history. Although these labels sound technical, they generally describe simple patterns within a chosen group of past results. The meaning of a frequency count also changes according to the number of rounds included in the calculation.
This guide explains how WinGo number frequency charts work, how to calculate counts and percentages, why sample size matters and what repeated or missing numbers actually mean. It includes fictional examples to demonstrate the mathematics without claiming that the examples represent live Jai Club results.
What Is WinGo Number Frequency?
Frequency is the number of times a particular result appears within a defined group of observations. In a WinGo-style number chart, the possible numerical outcomes are commonly the digits 0 through 9, so a frequency table can count how often each digit appears.
If the number 4 appears three times in a group of twenty completed rounds, its observed frequency is three. The figure describes only those twenty rounds and does not establish how often 4 will appear in the future.
Frequency analysis becomes meaningful only when the observation window is clear. A number appearing five times in ten rounds has a different observed percentage from a number appearing five times in one hundred rounds.
How to Read a WinGo Number Frequency Chart
A typical frequency chart contains a number column and a count showing how many times that number appeared. More detailed interfaces may also display percentages, recent occurrence indicators and historical sequences.
The first step is to establish whether the chart includes the last ten, twenty, fifty or another number of completed periods. Next, identify whether the displayed values are actual numerical results rather than period identifiers or colour labels.
Finally, confirm that the data represents completed rounds. A pending period without a published number should not be counted as though its result were known.
Example: WinGo Frequency Over 20 Results
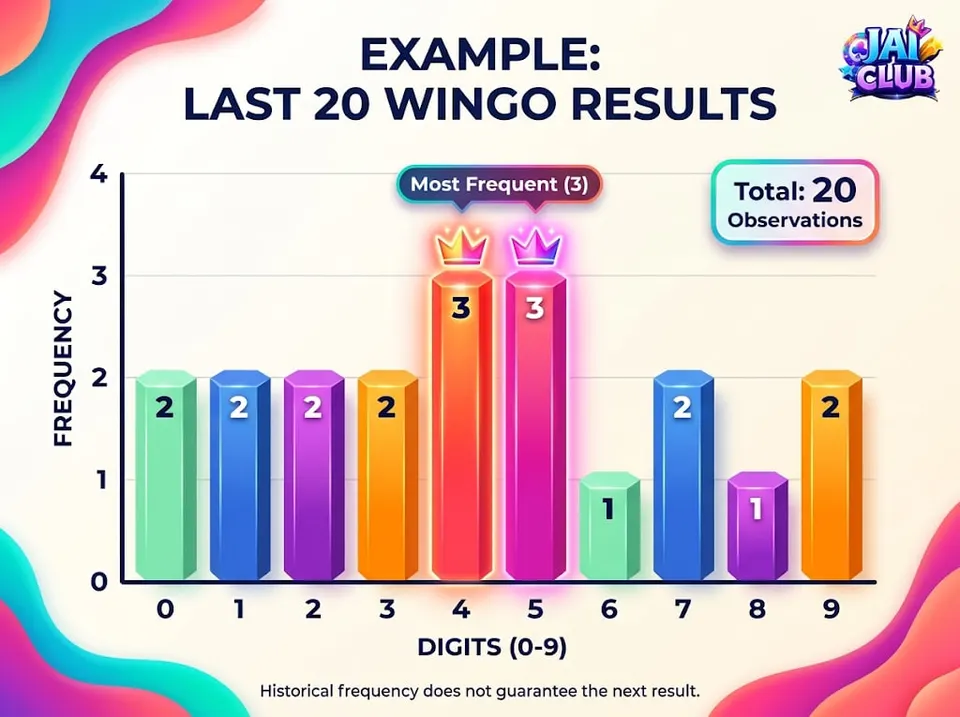
Consider the following fictional sequence of twenty results:
0, 2, 2, 3, 4, 4, 4, 5, 5, 6, 7, 7, 8, 9, 0, 1, 1, 3, 5, 9.
These figures are examples created for educational purposes. They are not live or archived results from a particular gaming platform.
| Number | Frequency | Percentage |
|---|---|---|
| 0 | 2 | 10% |
| 1 | 2 | 10% |
| 2 | 2 | 10% |
| 3 | 2 | 10% |
| 4 | 3 | 15% |
| 5 | 3 | 15% |
| 6 | 1 | 5% |
| 7 | 2 | 10% |
| 8 | 1 | 5% |
| 9 | 2 | 10% |
| Total | 20 | 100% |
Numbers 4 and 5 have the highest observed counts in this small example. Numbers 6 and 8 appear only once, while all ten digits appear at least once.
These observations describe the selected twenty results. They do not establish that 4 and 5 are intrinsically more likely to occur in the next round.
How to Calculate WinGo Number Percentages
A frequency percentage is calculated by dividing the number of times a result occurred by the total number of observations, then multiplying by 100.
For example, number 4 appears three times in twenty results. Its observed percentage is therefore:
(3 ÷ 20) × 100 = 15%.
The same method applies to any digit or category. A result appearing once in twenty observations represents 5% of the sample, while a result appearing twice represents 10%.
This calculation is useful for comparing counts within the same observation window. However, it is a historical percentage, not proof of the probability of that result occurring in the next round.
WinGo Hot Numbers Explained
The term hot number is often used for a digit that appears relatively frequently within a selected recent period. In the fictional twenty-round example, numbers 4 and 5 could be described as the most frequent numbers because they each appear three times.
However, a hot-number label depends entirely on the selected timeframe. If the chart were expanded to include another hundred completed rounds, the ranking might change substantially.
A number should not be considered more likely to appear next solely because it has recently appeared often. Historical frequency is a descriptive statistic, whereas future probability depends on the outcome-generation process.
What Are Cold or Missing Numbers?
A cold number is commonly used to describe a digit that has appeared infrequently within the selected period. A missing number is usually a digit that has not appeared at all within that period.
For example, if a fictional sample of ten completed rounds contains no result of 7, the frequency of 7 in that sample is zero. This means only that 7 did not occur during those ten observations.
It does not establish that 7 is due to appear in the next round. Random sequences can contain long gaps between occurrences, and a number being absent from a small sample does not imply that an independent future result must compensate for that absence.
WinGo Repeated Numbers and Streaks
A repeated number occurs when the same digit appears more than once within an observation period. A consecutive repeat occurs when the same digit appears in adjacent completed rounds.
For example, the fictional sequence 2, 2, 3, 4, 4, 4 includes two consecutive appearances of 2 and three consecutive appearances of 4.
These are different from colour streaks or Big/Small streaks. Two consecutive numbers can differ but still belong to the same colour or size category.
A chart should therefore specify what type of repetition it is measuring. A number streak, colour streak and size streak are not interchangeable statistics.
Number Streaks vs Colour Streaks
In common WinGo-style charts, individual digits may be associated with Red, Green or Violet. The colour of a result can repeat even when the numerical result changes.
For instance, the fictional sequence 2, 4, 6 and 8 contains four different numbers, but all four are associated with Red under a commonly used mapping.
A number-frequency chart would count each digit separately, while a colour-frequency chart could count all four under the same colour category. These charts answer different questions even when they are based on the same completed results.
The distinction matters when readers see a coloured trend line and mistakenly interpret it as repeated appearances of one exact number.
Why Sample Size Matters
Sample size is the number of observations included in an analysis. A chart using the last ten rounds has a smaller sample than one using the last one hundred rounds.
Small samples can display large percentage differences simply because every observation represents a substantial part of the total. In a ten-round sample, one appearance represents 10%, while in a one-hundred-round sample it represents only 1%.
This is why a frequency percentage should always be interpreted together with the sample size. A claim that a digit appeared 30% of the time provides little useful context unless the number of observations is also known.
Theoretical Probability vs Observed Frequency
In a hypothetical system where each digit from 0 to 9 is generated independently with equal probability, every digit has a theoretical probability of 10% on any particular round.
An observed frequency chart might nevertheless show substantial differences over short periods. One digit might appear several times, while another may not appear at all.
This does not automatically contradict equal theoretical probabilities. Random variation can produce uneven short-term samples.
However, the assumption of an independent uniform distribution must be supported by the applicable game's rules or technical documentation. A publicly displayed chart alone cannot verify the underlying result-generation system.
Can WinGo Frequency Predict the Next Number?
A frequency chart cannot guarantee the next result simply by counting past outcomes. Even where a mathematical model provides a known probability distribution, the actual outcome of a particular future random event remains uncertain.
For example, number 4 appearing three times in the last twenty rounds does not establish that it will appear again immediately. Similarly, number 8 appearing only once does not establish that the system must produce another 8 soon.
A historical table can describe what has happened. Predicting the next independent outcome would require evidence that the past sequence contains useful predictive information, which ordinary frequency counts do not establish.
Why Hot and Cold Predictions Can Be Misleading
Prediction systems sometimes describe a frequently appearing number as hot and recommend continuing to expect it. Other systems describe a missing digit as cold and suggest that it is due to return.
These approaches can contradict one another because they interpret the same historical sequence through different assumptions. Neither interpretation becomes reliable solely because it uses percentages, charts or a professional-looking dashboard.
It is important to distinguish the visual sophistication of a tool from the evidence supporting its claims. A chart may be mathematically accurate about past counts while offering no dependable forecasting advantage.
WinGo Result Frequency vs Period Number
A period number identifies a specific round, while the result number records the outcome of that round. A frequency calculation should count the result digits, not digits appearing inside the period identifiers.
For example, a period identifier containing several instances of the digit 2 does not mean that the corresponding game result was 2. The period number and result number serve different purposes.
This distinction is especially important when a result-history table displays both columns close together on a mobile screen.
How to Compare the Last 20 and Last 100 Results
Comparing two observation windows can show whether the observed distribution changes when more historical data is included. A twenty-round chart may be heavily influenced by a short streak, while a one-hundred-round chart incorporates more observations.
The larger sample can provide a more stable descriptive picture of past outcomes, but it still does not guarantee that the next result will follow the observed proportions.
Readers should also ensure that the windows refer to the same game mode. Mixing results from different WinGo durations or unrelated operators can produce a chart that does not describe any one consistent data source.
Frequency Charts and Different WinGo Durations
Some WinGo-style games use different round intervals, such as 30 seconds, one minute, three minutes or five minutes. A frequency chart should identify which mode generated its results.
A chart based on one-minute rounds should not automatically include results from a five-minute mode. Even when both games use the same digit range, they may maintain separate period histories.
This is an organisational issue rather than evidence that one duration is more predictable. Correctly labelling the data source is essential before calculating or interpreting historical counts.
Can Frequency Analysis Detect a Problem?
An unusual historical distribution can sometimes raise a question worth investigating, but it does not independently prove a technical error or manipulation.
A proper assessment would require a defined statistical model, an appropriate sample size, reliable records and an understanding of how the results are generated.
A short run of repeated digits is not sufficient to establish that the underlying system is defective. The distinction between an observation and a verified conclusion should always be maintained.
Frequently Asked Questions
What is WinGo number frequency?
It is the number of times each digit appears within a selected group of completed rounds.
How do I calculate WinGo number percentages?
Divide the frequency of a digit by the total observations and multiply by 100.
What does a hot number mean?
It is an informal label for a digit that appears frequently in a chosen historical window.
What is a cold number?
It usually refers to a digit appearing infrequently or not at all within a selected period.
Does a missing number have to appear next?
No. Absence from previous rounds does not guarantee a future appearance.
Can a number repeat several times?
Yes. Repeated results and streaks can occur.
Is a colour streak the same as a number streak?
No. Different digits can share the same colour classification.
Is a twenty-round chart enough to predict the next result?
No. A short historical chart does not establish a reliable prediction method.
Does a 10% theoretical probability mean exactly one result in every ten rounds?
No. A theoretical probability does not require each short group of ten observations to contain exactly one occurrence.
Can I mix different WinGo durations in one frequency chart?
Only if the chart is explicitly designed to describe a combined dataset. For individual mode analysis, results should be separated.
Final Thoughts
A WinGo number frequency chart can help readers organise completed results, calculate historical percentages and identify repetitions within a chosen period. It is useful for understanding descriptive statistics but should not be confused with an accurate forecasting system.
Sample size, period identifiers and game modes are essential context. A hot number is not automatically more likely to continue, and a missing number is not automatically due to appear next.
For more educational explanations of numbered results and game history, browse the Wingo category. This article provides independent information and does not claim to predict future results.