Manual WinGo Result Log: Numbers 0–9 Ko Table Mein Record Karein
Create a manual WinGo result log using a spreadsheet. Learn how to record period IDs, numbers 0–9, timestamps, game modes, missing results and simple frequency counts.
In this article
- What Is a Manual WinGo Result Log?
- WinGo Result Log Mein Kya Record Karein?
- Step 1: Choose Excel or Google Sheets
- Step 2: Keep the Correct Game Mode
- Step 3: Record the Full Period ID
- Step 4: Record the Completed Number
- Step 5: Record the Timestamp Carefully
- Step 6: Create Your First 12-Result Table
- Step 7: Calculate Number Frequency
- Step 8: Use COUNTIF in Excel or Google Sheets
- Step 9: Calculate Historical Percentages
- Step 10: Check for Missing Results
- Step 11: Check Duplicate Period IDs
- Step 12: Avoid Mixing Numbers With Period Digits
- Step 13: Preserve the Original Data
- Step 14: Compare Different Sample Sizes
- WinGo Result Log vs Result Prediction
- Can a Manual Log Verify a Game's Fairness?
- How to Keep a Clean WinGo History Sheet
- Frequently Asked Questions
- What is a manual WinGo result log?
- Can I use Google Sheets to record WinGo results?
- Can Excel count results from 0 to 9?
- Should I record the period ID?
- Is zero a valid WinGo result?
- Should pending results be entered as zero?
- Can I mix three-minute and five-minute rounds?
- Does a frequency table predict the next result?
- Can I use fictional results for practice?
- Does jaiclub-game.com provide an official live result feed?
- Conclusion
- Sources and Methodology
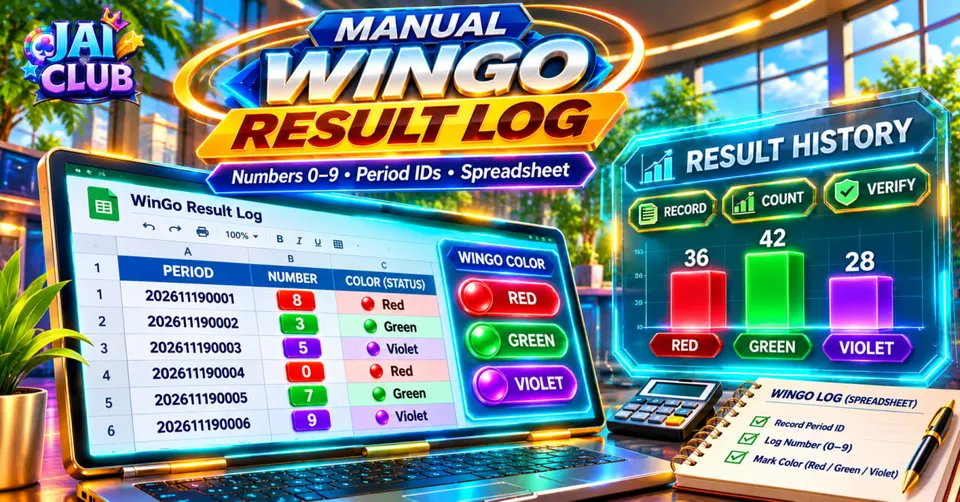
A manual WinGo result log is a table used to record completed game results, usually including the period number, result digit and relevant timestamp. It can be created in Excel, Google Sheets or another spreadsheet application. The purpose is to organise historical information clearly rather than relying on memory or screenshots.
A useful log should preserve the game mode, the full period identifier and the result number from 0 to 9. It should also distinguish completed results from pending rounds and keep different WinGo durations separate.
This guide explains how to build a manual WinGo result log, enter sample data, calculate frequencies and identify missing or duplicated records. The examples are fictional and do not represent actual Jai Club WinGo outcomes. The spreadsheet is an educational record-keeping tool, not a system for predicting future game results.
What Is a Manual WinGo Result Log?
A result log is a structured record of completed game rounds. Each row normally represents one identified round, while the columns describe its relevant information.
The main advantage of a log is consistency. Instead of comparing screenshots from different periods, a reader can organise the results into one table with clear labels.
For example, one row may contain a period identifier, a completion time and result 4. Another row may contain the next period and result 7.
The log can then be checked for missing periods, duplicate entries and basic historical frequencies.
WinGo Result Log Mein Kya Record Karein?
A useful table contains enough information to identify one completed result without adding unnecessary details.
The following fields provide a practical starting point.
| Column | Field | Purpose |
|---|---|---|
| A | Game mode | Identifies round duration |
| B | Period ID | Identifies the completed round |
| C | Result time | Records displayed timestamp |
| D | Result number | Digit from 0 to 9 |
| E | Result status | Completed, pending or unverified |
| F | Notes | Records unusual display issues |
This structure can be expanded if the source provides additional information.
However, the log should not contain passwords, OTPs, account tokens or other private authentication information.
Step 1: Choose Excel or Google Sheets
Excel and Google Sheets can both organise tabular information and calculate basic statistics.
Open a blank spreadsheet and create the six column headings described above.
A spreadsheet is preferable to an unstructured note when the user wants to compare many completed periods because each result remains associated with a specific identifier.
Google Sheets can be convenient for editing across devices, while Excel can be useful for local file management. The choice does not change the basic recording method.
Step 2: Keep the Correct Game Mode
Some WinGo-style services display different durations, such as 30 seconds, one minute, three minutes or five minutes.
Each mode may have its own period sequence and result history.
A log combining these modes without a label can be misleading because the rows may not represent one continuous sequence.
For this reason, the first column should identify the mode. Alternatively, a separate worksheet can be created for each mode.
Our existing WinGo 30 Seconds vs 1 Minute comparison explains why round duration affects the number of completed records within a fixed observation period.
Step 3: Record the Full Period ID
A period ID identifies a particular round. It should not be confused with the result number.
For example, the fictional identifier W3-0001 could refer to one three-minute round, while the result number for that round might be 7.
The period ID should be stored as text when necessary, especially if it contains leading zeros.
Removing leading zeros or converting a long identifier to scientific notation can make later comparisons difficult.
For a broader explanation of identifiers and result history, see our WinGo period number guide.
Step 4: Record the Completed Number
The result-number column should contain the digit displayed for the completed period.
In a common WinGo-style format, the numerical results range from 0 through 9.
A completed round showing 0 should be recorded as zero, not left empty. Zero is a valid numerical value in this model.
An empty cell should instead indicate that the result has not been entered or verified.
This distinction is essential when calculating averages, counts or missing values.
Step 5: Record the Timestamp Carefully
A timestamp provides context about when the result was displayed or recorded.
However, not every source uses the same time zone or timestamp definition.
For example, a displayed timestamp may refer to round closure, result posting or another system event. It should not automatically be interpreted as the exact time of result generation.
If the source identifies Indian Standard Time, record IST. If the time zone is unknown, mark it as unknown rather than assuming it is local.
The objective is to preserve the information accurately, not convert a timestamp using an unsupported assumption.
Step 6: Create Your First 12-Result Table
The following table contains twelve fictional completed results from one hypothetical game mode.
| Period ID | Result number |
|---|---|
| W3-0001 | 0 |
| W3-0002 | 2 |
| W3-0003 | 2 |
| W3-0004 | 7 |
| W3-0005 | 5 |
| W3-0006 | 9 |
| W3-0007 | 4 |
| W3-0008 | 4 |
| W3-0009 | 1 |
| W3-0010 | 8 |
| W3-0011 | 0 |
| W3-0012 | 3 |
These period identifiers and results are examples created for this guide.
The table demonstrates how each row preserves one result and its associated identifier.
No conclusion about future results follows from this sequence.
Step 7: Calculate Number Frequency
Frequency means the number of times a result appears within a selected sample.
In the twelve-result example, 0 appears twice, 2 appears twice and 4 appears twice.
The other displayed values appear once, except 6, which does not appear.
A frequency table makes these counts easier to see.
| Number | Count | Observed percentage |
|---|---|---|
| 0 | 2 | 16.67% |
| 1 | 1 | 8.33% |
| 2 | 2 | 16.67% |
| 3 | 1 | 8.33% |
| 4 | 2 | 16.67% |
| 5 | 1 | 8.33% |
| 6 | 0 | 0% |
| 7 | 1 | 8.33% |
| 8 | 1 | 8.33% |
| 9 | 1 | 8.33% |
| Total | 12 | 100% |
Percentages are rounded. The exact percentages sum to 100%.
A digit appearing twice in twelve rounds has an observed frequency of 2/12, approximately 16.67%.
This calculation describes only the sample. It does not establish that the digit will appear with the same frequency in the future.
Step 8: Use COUNTIF in Excel or Google Sheets
Assume the twelve result numbers are stored in cells D2 through D13.
To count how many times the digit 4 appears, use:
=COUNTIF(D2:D13,4)
The formula returns 2 for the fictional sample.
To count the digit 6, use:
=COUNTIF(D2:D13,6)
The formula returns 0.
For a reusable frequency table, place the digits 0 through 9 in cells H2 through H11. Then enter this formula in I2:
=COUNTIF($D$2:$D$13,H2)
Copy the formula down to I11.
The spreadsheet will calculate the historical count for each listed digit.
Step 9: Calculate Historical Percentages
A frequency percentage is the count of one digit divided by the number of valid observations.
If the counts are in column I, a simple percentage formula can be:
=I2/COUNT($D$2:$D$13)
Format the cell as a percentage and copy it down.
For the fictional sample, the digit 0 appears twice among twelve observations, so its percentage is approximately 16.67%.
The calculation should include only confirmed results belonging to the selected game mode.
If pending rounds are included as zero values, the percentage table becomes inaccurate.
Step 10: Check for Missing Results
A missing result may be caused by an unrecorded row, an incomplete source or a display delay.
For example, a log may contain W3-0010 followed by W3-0012, with no entry for W3-0011.
That does not automatically prove the game skipped a round.
The relevant period may simply be absent from the manual dataset.
The correct response is to compare the missing identifier with the original completed-history source before inserting a value.
Do not fill missing results with a guessed number.
Step 11: Check Duplicate Period IDs
A duplicate period ID can indicate that the same completed round was entered twice.
It can also reflect different game modes or separate records if the full identifying information was not preserved.
One useful spreadsheet method is to compare the combination of mode and period ID rather than period ID alone.
For example, a fictional W3-0010 belonging to a three-minute mode is not necessarily the same record as an identifier with a similar number in another mode.
A duplicate check should therefore use the complete source information.
Step 12: Avoid Mixing Numbers With Period Digits
A common recording error occurs when a user counts digits from period identifiers instead of the actual result-number column.
For example, a period ID containing several digits 2 does not mean the round result was 2.
The period identifier is an administrative reference.
The result digit is a separate outcome.
In the recommended spreadsheet structure, keeping these values in different columns reduces the chance of counting the wrong data.
Step 13: Preserve the Original Data
A useful manual log should make it possible to distinguish the source data from later analysis.
The result-number column can remain unchanged while separate columns calculate counts or percentages.
If an entry is corrected, the reason for the correction should be recorded.
For example, a note might say that the original row belonged to the wrong mode or that the completed result was confirmed later.
This approach is more transparent than silently replacing historical numbers.
Step 14: Compare Different Sample Sizes
A twelve-result log describes a small group of observations.
A larger dataset may show different historical percentages, even when the mathematical probability model remains unchanged.
For example, a digit appearing twice in twelve rounds has an observed share of 16.67%. The same digit appearing twice in one hundred rounds has a share of only 2%.
The count alone is therefore insufficient without the sample size.
Our published WinGo Number Frequency guide explains how sample size affects the interpretation of hot numbers, cold numbers and streaks.
WinGo Result Log vs Result Prediction
A result log describes completed rounds. A prediction attempts to determine an outcome before it occurs.
These are separate activities.
A spreadsheet can calculate historical frequencies accurately without providing a dependable way to forecast future independent results.
For example, the absence of digit 6 from twelve fictional rounds does not mean that the next result must be 6.
Statistical descriptions of the past should not be presented as guarantees about future outcomes.
Can a Manual Log Verify a Game's Fairness?
A log can help document what the interface displayed, but it does not independently verify the underlying random-number-generation system.
A proper fairness assessment would require reliable records, a defined mathematical model and information about the result-generation process.
A small sample containing repeated digits or unusual streaks does not prove manipulation.
A manual table is useful for organisation and descriptive analysis, not a substitute for a technical audit.
How to Keep a Clean WinGo History Sheet
A clean sheet should preserve all completed results, label game modes and avoid treating empty cells as actual zeros.
It should also keep period IDs as text where necessary and record the time zone only when known.
The most important goal is traceability: another reader should be able to understand which period produced each recorded result.
This makes the log more useful than a list of digits copied without context.
Frequently Asked Questions
What is a manual WinGo result log?
It is a table that records completed rounds with information such as period IDs, numbers and timestamps.
Can I use Google Sheets to record WinGo results?
Yes. Google Sheets supports the table structure and formulas used in this guide.
Can Excel count results from 0 to 9?
Yes. The COUNTIF function can count each digit in a selected range.
Should I record the period ID?
Yes. It helps associate each result with its correct completed round.
Is zero a valid WinGo result?
Yes, in a number format that uses the digits 0 through 9.
Should pending results be entered as zero?
No. A pending or missing result should be distinguished from the actual number 0.
Can I mix three-minute and five-minute rounds?
They should be labelled and preferably analysed separately.
Does a frequency table predict the next result?
No. It describes previously recorded observations.
Can I use fictional results for practice?
Yes. Clearly labelled fictional data can help demonstrate spreadsheet calculations.
Does jaiclub-game.com provide an official live result feed?
This independent website provides educational information and does not claim to operate the game's live result service.
Conclusion
A manual WinGo result log is most useful when each completed round is recorded with its mode, period identifier, result digit and appropriate status.
A spreadsheet can then calculate historical frequencies and identify missing or duplicated rows without confusing record keeping with prediction.
The example formulas provide a repeatable method for organising completed data. They do not establish a future winning pattern or independently verify a game's result-generation process.
Sources and Methodology
The twelve-round dataset is fictional. All frequencies and percentages are calculated directly from those twelve recorded values.
Spreadsheet formulas use standard COUNTIF and COUNT functions. Platform-specific result histories and period formats must be checked against the relevant service.